HTML · Math
Taylor Series Visualizer
An interactive visualization of Taylor series approximations for Calc BC.
Open the visualizer · How to use it · Repository contents
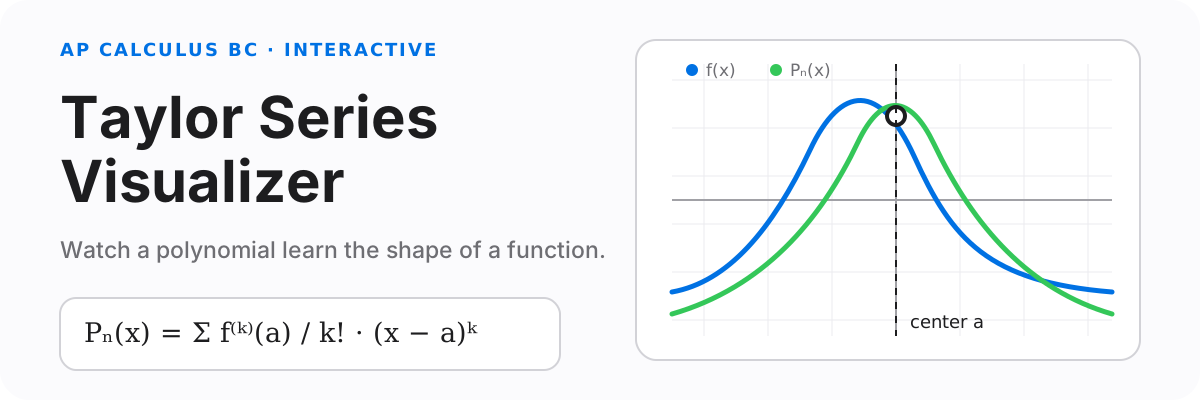
An interactive companion for seeing how a Taylor polynomial closes in on a function. Choose a function, move the center point, and change the number of terms while the equation and graph update together.
Explore an approximation
- Choose
sin(x),cos(x),eˣ, orln(x). - Move the center point (a) from
−5to5. - Increase the polynomial from
1to20terms. - Compare the blue source function with the green Taylor polynomial.
- Zoom the graph to inspect where the approximation separates.
The visualizer keeps the general definition in view:
Pₙ(x) = Σ [f⁽ᵏ⁾(a) / k!] (x − a)ᵏ
          k=0…n
and renders the selected polynomial with KaTeX as the controls change.
What to notice
- More terms usually improve the approximation near the center point.
- Moving (a) changes where the polynomial is locally most faithful.
- The useful interval is not unlimited; zooming out makes divergence easier to see.
ln(x)is only defined for positive inputs, so its graph has a different valid domain from the other choices.
Inside the export
This repository contains the production build used for static deployment:
index.html                  application entry page
assets/index-*.js           visualizer controls and graph logic
assets/math-lib-*.js        expression parsing and derivatives
assets/recharts-*.js        plotted source and approximation curves
assets/katex-lib-*.js       mathematical typesetting
assets/index-*.css          responsive presentation
The original React and TypeScript source files are not included in this snapshot. The checked-in JavaScript is compiled output.