Desmos Bezier Renderer
Transforms images into Desmos art using Canny edge detection and Potrace to create parametric Bézier curves. Optimized for macOS.
Open the live renderer · Run locally · See the pipeline
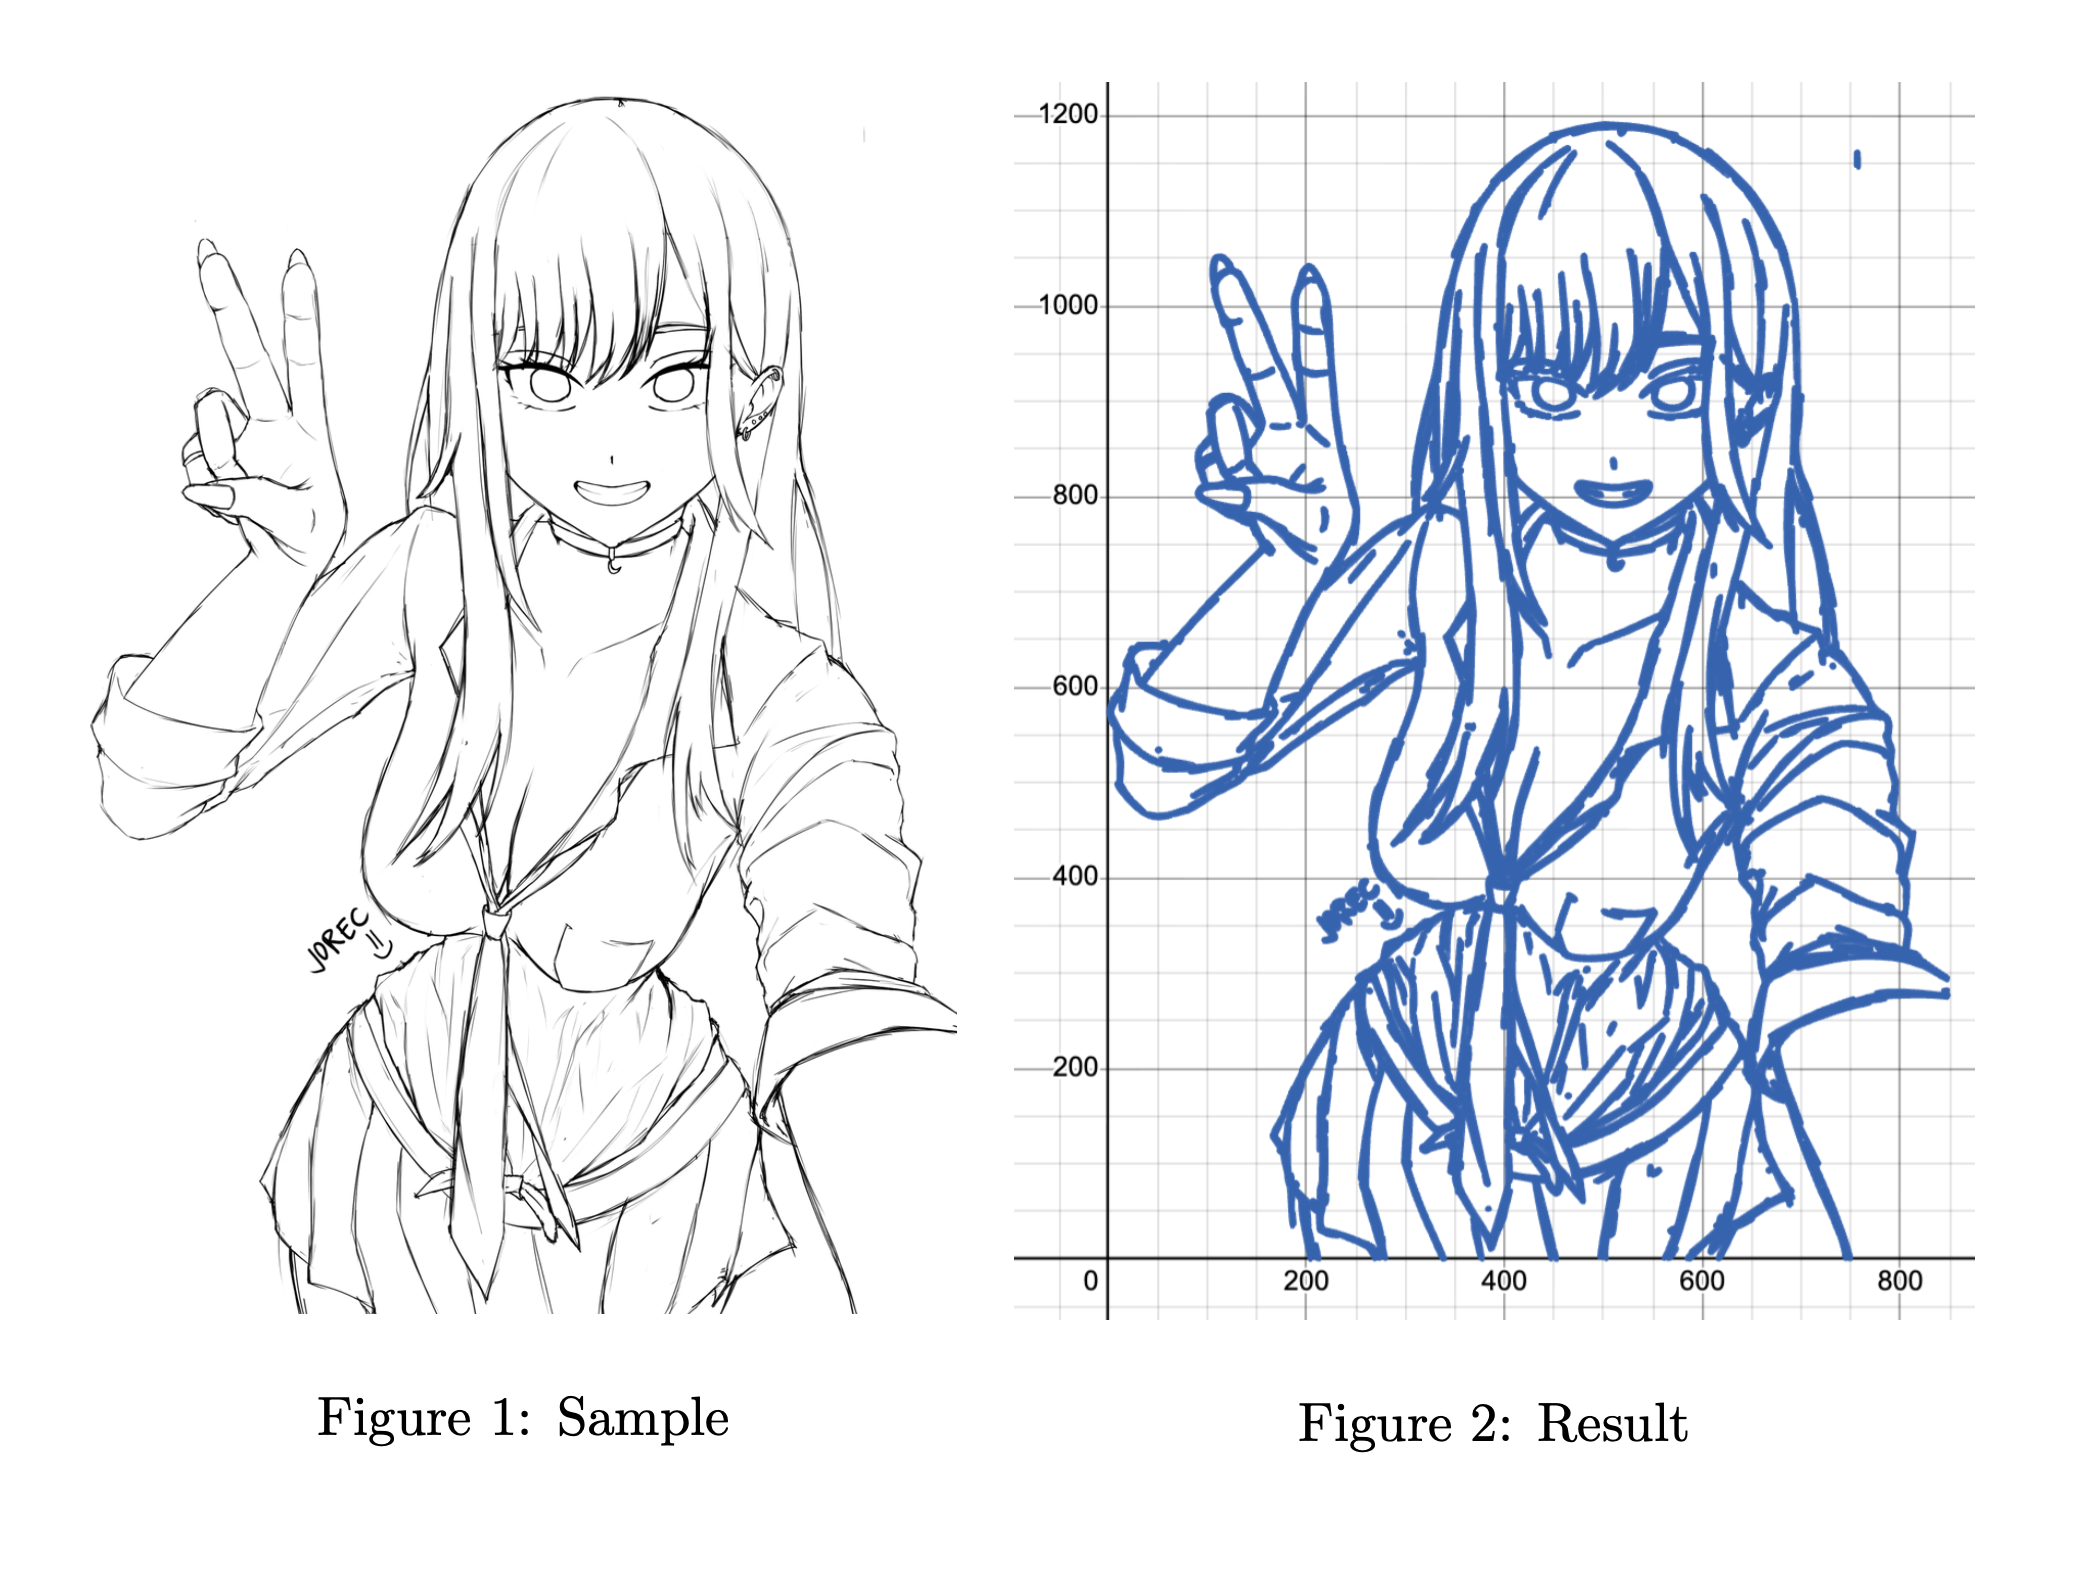
Turn an image into a set of parametric Bézier expressions and draw the result inside Desmos. The renderer combines OpenCV edge detection, Potrace vectorization, a small Flask API, and the Desmos calculator API.
From pixels to equations
uploaded image
     ↓
grayscale + Canny edges
     ↓
Potrace line and cubic segments
     ↓
parametric LaTeX expressions
     ↓
Desmos calculator
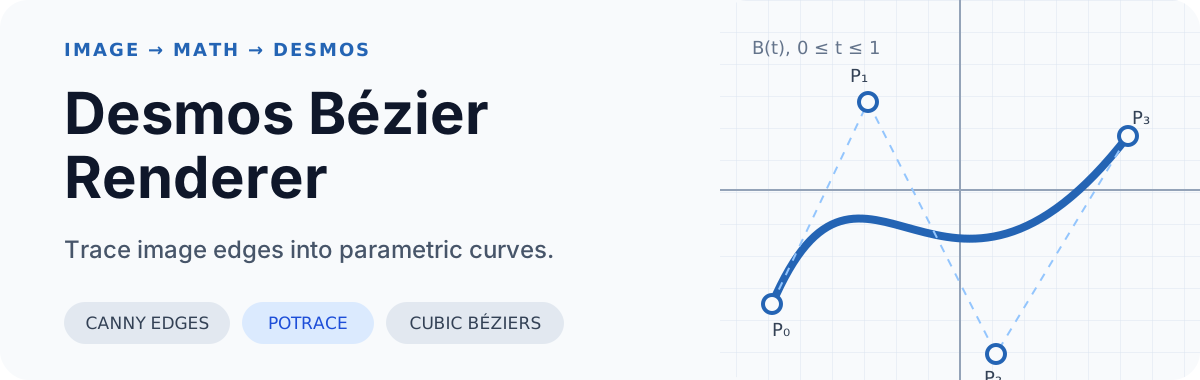
Each traced line segment becomes a linear interpolation. Each smooth segment becomes a cubic Bézier curve:
B(t) = (1−t)³P₀ + 3(1−t)²tP₁ + 3(1−t)t²P₂ + t³P₃
The browser sends an image to POST /render, receives the generated
expressions and source dimensions, then loads the expressions into the
embedded calculator.
Try it
- Open the live renderer.
- Choose or drop an image.
- Render it and let the calculator draw the traced outline.
High-contrast line art produces the clearest result. Detailed images can generate many expressions and take longer to display.
Run it locally
Requirements
- Python 3.12 or newer
- Potrace and
libagg
On macOS:
brew install potrace libaggThen install and start the app:
git clone https://github.com/ChinesePrince07/DesmosBezierRenderer-mac.git
cd DesmosBezierRenderer-mac
python3 -m venv .venv
source .venv/bin/activate
pip install -r requirements.txt
python backend.py
Open http://127.0.0.1:5001/calculator.